March 28, 2018
March 2018 Outlook
We are at the at the end of quarter one 2018 and perhaps at a crossroad. The major global economies are witnessing growth and GFC is almost a forgotten blight on the landscape. Central banks are either raising interest rates as in the case of the US, or withdrawing surplus liquidity from their money supply as in the case of Europe. China is attempting to steady the ship with a growth target of 6.9% GDP and the RBA Governor has been putting subtle language around the next movement of interest rates likely to be upwards, rather than down, with a neutral cash rate implied at around 3.5%. Currently, Australia has an overnight target cash rate of 1.5%.
Our last paper in August of 2017, had similar a similar theme and this still continues, but……
BBSW, Overnight & RBA Repo
There has been significant movement in the quarterly BBSW rate since around November 2017 and we think there is a good risk management strategy that can be deployed before everyone is running for the door at the same time.
Firstly we would like to provide a precis around why the quarterly BBSW has increased and the possible ramifications this has. There have recently been some industry articles about this particular topic, but we feel that if we go down this path with all of the acronyms and market jargon, we will miss the mark of explanation and correlation for a significant proportion of our readers.
The repurchase agreement rate is the rate at which the RBA and fund managers who hold commonwealth government securities will lend to the professional market for liquidity purposes (secured lending). As we write this paper, we notice that the repo rate 22/3/18 that has traded with the RBA on this day has traded at 2%. Tenor on this has been between 14 to 53 days for funding. This is the cost of borrowing secured funding with the RBA/or repo holder against a targeted cash rate of 1.5%.
I can hear the question of why can’t you borrow in the 11AM market? The answer is that you can if you’re a rated corporate or another financial institution. Some smaller corporate organisations also have smaller 11am line liquidity access, but 11am is not core funding, with lines being very short tenors of less than seven days and the 11am market has also moved out in line with the repo market, closer to 1.85%-1.90%.
Why has this occurred?
This is part subjective, part anecdotal.
Driving US Libor- OIS spreads wider have contributing factors of debt supply, repatriation of funds post tax policy adjustments, regulation and monetary policy.
Throughout most of last year, larger financial institutions, banks and investment banks, were able to raise wholesale funds offshore and then swap back those currencies via the basis of bills/libor to A$ funding at cheaper costs (sub BBSW) than accessing capital markets onshore. When referring to bank funding, we are always acknowledging that there is no single funding stream for a financial institution (FI), but a mix of funding mechanisms.
As part of the regulatory environment, all banks (FI’s) need to hold more liquidity and therefore pressure has been placed upon funding costs. It is possible that one or more FI’s, have found themselves short of liquidity and hence the pressure to cover themselves has placed pressure on quarterly and semi annual BBSW. This is now trading at 1.965%. Banks don’t really fund themselves via the 30 day BBSW wholesale cost of funds and so the mechanism, BBSW quarterly & semi have pushed higher.
US bond rates are now higher than AUD bond rates so the cycle of inflation commencing to increase, capital outflows, a lower currency (from capital outflows) possibly also attributable to the US lowering corporate tax rate and prospect of domestic rate hikes at some future stage, add to the funding pressures. The arbitrage of borrowing cheaply in dollars and swapping back into AUD through FX forwards has also tended to cease.
Expectation by some forecasts is that as 3m BBSW as gets closer to 2%, with the RBA on hold indefinitely, that demand for yield will be sufficient to cap and reverse the spread, although the US linkage will likely keep the spreads wider than previously.
Rates Strategy
Most forecasters concur that the earliest a local rate rise could occur would be November or thereabouts this year. Several are forecasting at least one or two in 2019 and a few forecast no rate rises until post 2019.
So how can a borrower protect themselves? Well, firstly, we have seen many periods through quite a few cycles over quite a few years when borrowers have become comfortable with their existing ratio of fixed/floating debt and tend not to focus on projections. Part of that is that rates have really only been trending downwards over the past five plus years.
We see a few aspects in this regard. Existing hedges that have been previously put in place are dynamic in their valuations and maturity profiles. Borrowers who have been fortunate to hedge at lower rates previously, will need to address a maturity at some point. It is more probable for the greatest part, that most borrowers have facilities and hedges for between 3-5 years in tenor.
One strategy is to be pro-active and address the extension of hedging now rather than wait until the hedge is about to expire. The unknown then is what will the yield curve and rates be like in the future?
The cost of carry; as quarterly BBSW has pushed out, one of the resistance points of the corporate borrower has been the reluctance to pick up the cost of carry, ie, the difference between the fixed rate of a swap and the floating index being either BBSW or BBSY. This has now narrowed to around 30-40 bpts. This can be considered balance sheet insurance.
With that in mind, we have a suggested strategy for covering debt based upon current term pricing before borrowers are all rushing for the exit at the same time. At that point, the curve will have already steepened further and the cost of hedging/fixing rates will be higher.
If looking for an example of why to cover debt for longer term or restructuring tenors, a quick review from one of the major bank economists expect three rate rises in 2019. One could only imagine what that effect would have on 90 day BBSW. Simple calculations would bring the cash rate up by 75 bpts (and BBSW), which now would exceed the 30-40 bpts of carry under a swap.
One example of strategy: * please note that none of the examples following have taken into account credit and transactions charges.
Hedge under a swap for 10 years. At this point, most of you probably have the giggles, right. Well, just bear with us for a moment.
Usually, unless you have commercial property with A grade tenants and long term leases, or are some type of government or statutory authority, it would be most unlikely for any bank to grant 10 year derivative/hedging limits. Not at least without some right to break probably at the end of 5 years. There is another way to possibly achieve this outcome. First, an assessment of current mid market rates:-
BBSW Quarterly Mid market rates:-
3Y – 2.23%
4Y – 2.34%
5Y – 2.42%
7Y – 2.57%
10Y – 2.75%
If assuming, that a five year facility exists, the extension of an additional 5 years of fixed cover can also be achieved by purchasing optionality and in this example it would be to buy a payer swaption – the right to enter into a swap at the end of 5 years for a further 5 years.
This does have some credit and cost implications, but for the purpose of this example, we will demonstrate all up pricing:-
- 5 year swap @ 2.40%
- Purchase swaption 5 years forward with 5 years fixed – forward value 3.10%
- Premium to pay of 58 bpts
- Average worst case rate for 10 year term using above assumptions 3.04%
The opportunity to consider a strategy such as this is current and all too often we will look back in time and remember when rates were trading in the mid 2’s%, thinking how good would that be now…
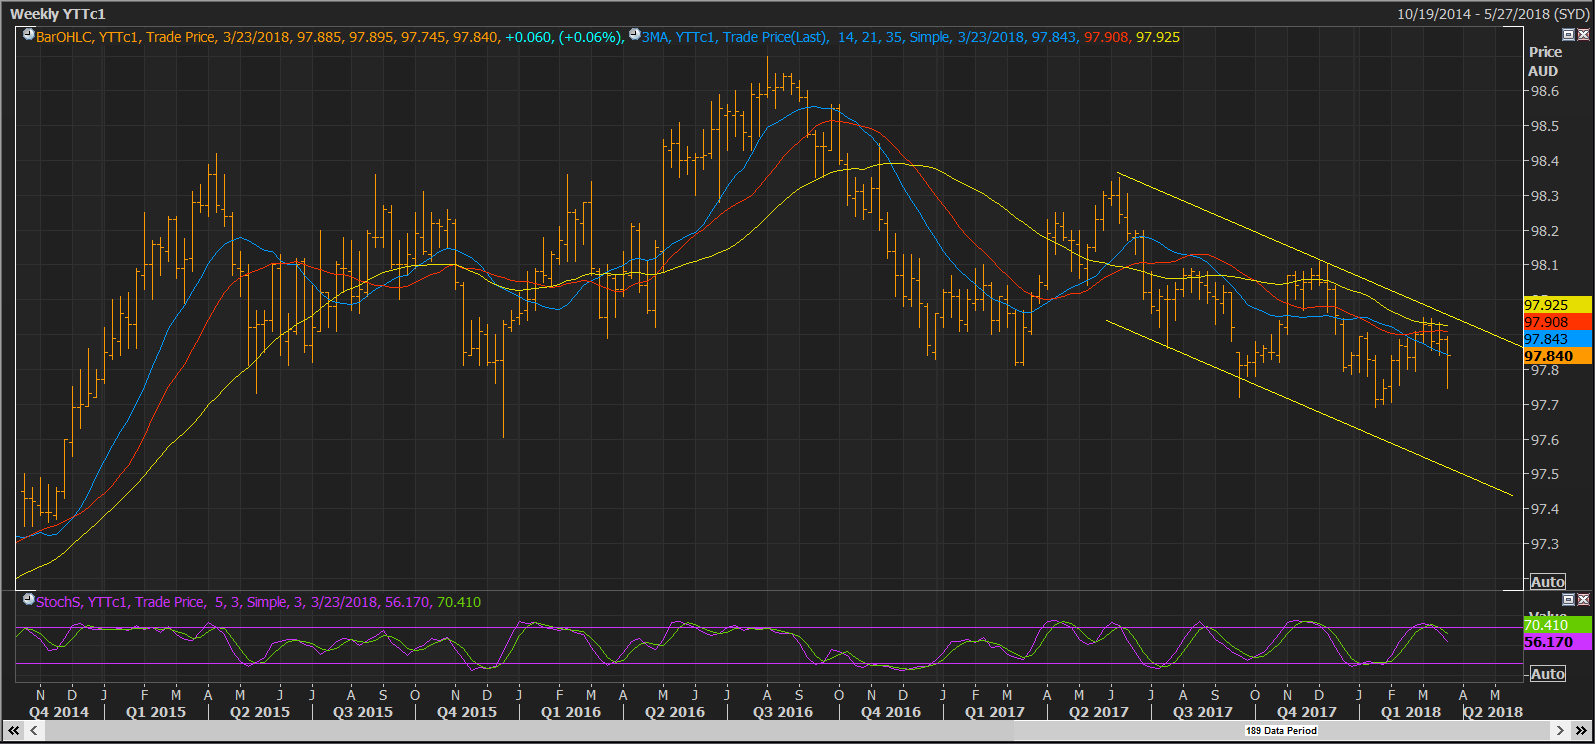
3 Year bond futures chart (weekly) – Trend channel on a downward trajectory since Q2 2017
Thirty Day Interbank Futures Contract – the forecast of future movements in the RBA cash rate.
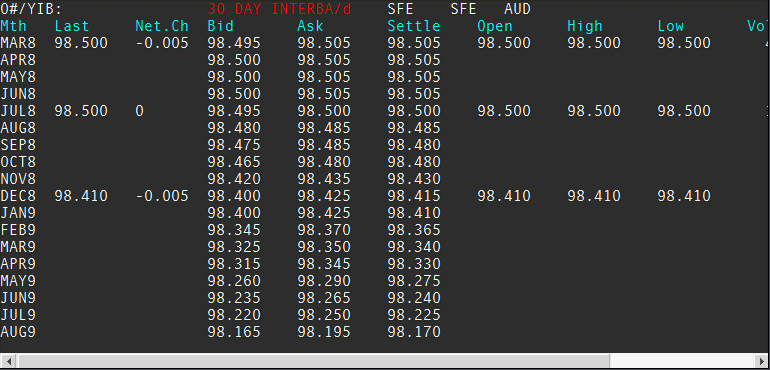
As can be identified in the above table, the forecast for rate rises in 2018 is rather benign, however it is does have greater probability commencing and increasing in 2019.
Please contact us to discuss any strategy or risk management requirements you may have.
Russell Maisner
Director, Global Treasury Risk Management Pty Ltd
Email: Russell@ecommplanet.com
Ph + 61 (0)401 125858