March 28, 2019
March 2019 Outlook
It has been a while since our last interest rate outlook paper (Oct 2018), and the landscape appears to have changed.
In our last Outlook, we tended to agree with a number of other forecasters that interest rates have a tightening bias, but wouldn’t look to move until late 2019 at the earliest. We feel that we were partially correct. Partially correct in that we believe that rates will likely move later this year, but in a totally different direction to the one we had expected.
The market certainly is pricing expectations this way now. The RBA has articulated that with the current stimulatory policy, there is little need to adjust policy. The final paragraph from the RBA Monetary Policy Statement in March reads:-
‘The low level of interest rates is continuing to support the Australian economy. Further progress in reducing unemployment and having inflation return to target is expected, although this progress is likely to be gradual. Taking account of the available information, the Board judged that holding the stance of monetary policy unchanged at this meeting would be consistent with sustainable growth in the economy and achieving the inflation target over time.’
So why are the 3 year bond futures trading at an implied yield of 1.39% which means that fixed rate swaps are sub the cash rate?
Trying to explain market movements is an inexact science with a multitude of factors of both internal and external having influence over the level and pricing – by way of example, no different than a particular equity stock that may rally 30%. There is usually a fundamental reason behind this, but momentum plays a large part.
We could identify, trade wars, Brexit, global slowdown, the US growth being having the slowest growth recovery over the past fifty years, royal commission of banks in Australia, a dovish US Federal Reserve, subsequent rally of US treasuries and expectations of US interest rate easings, a slowing local property sector, ie, private sector dwellings excluding houses are down 51% year on year (Jan 2018-Jan 2019), with total dwelling units approved down 28.6% YOY.
Locally, adding tighter credit and regulatory conditions which may be the single most significant factor as to why rates are rallying. The result of which appears to be that banks are taking less risk than previously and without a bank taking risk, the economy will slow. As the governor of the RBA has previously stated, ‘banks need to take risk and not just assume risk’. There is a difference.
So the market believes (at this point) that the RBA will be forced into an easing of the cash rate, albeit they may have to be dragged kicking and screaming to do so.
But what if the market has got it wrong…
What if the RBA doesn’t adjust the cash rate and relies upon other forms of economic stimulus.
We have witnessed this previously and even if the market is validated by the RBA ultimately adjusting policy downwards, historically, the market always overshoots this move.
When the market forecasts and preempts a number of easings or tightenings, the movement of futures contracts is usually exceeded by an overly exuberant and momentum driven market. These current values may in fact be providing one of those rare opportunities.
If this were to be the case, then there is an unprecedented opportunity to lock in a fixed borrowing rate at not only sub floating rate benchmark (BBSW) (positive carry), but also at sub the current RBA official cash rate.
We wanted to highlight the significant move which has occurred and have purposely left the chart in below as this was a previous YOY comparison of swap rates from last October. The chart following (2), will also be a YOY A$ Swap Rate chart and it probably doesn’t require a whole lot of explanation.
A$ Swap YOY comparison 10/16/2017 – 10/16/2018

A$ Swap YOY comparison 03/25/2018 – 03/25/2019
(2)
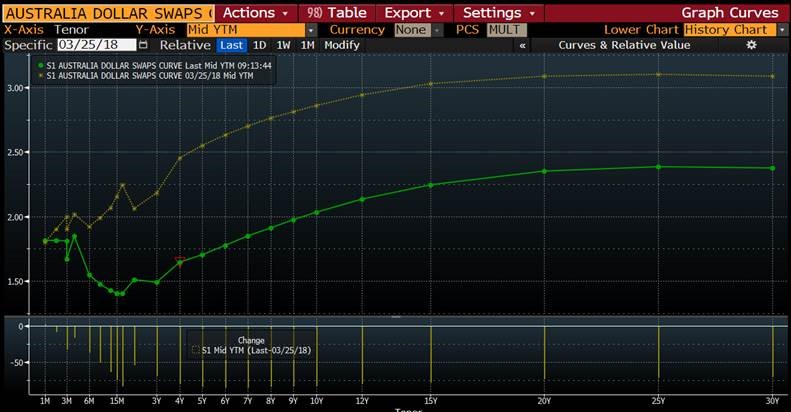
The market is currently at a level which regardless of whether the RBA will ease cash or adopt some other form of stimulus, whether that be quantitative easing or reliance upon fiscal stimulus, presents an opportunity to fix at an unprecedented low rate of interest. How low? We will identify the existing mid market rates below.
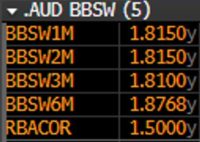
1) BBSW (mid market index)
2) Mid market Swap Rates
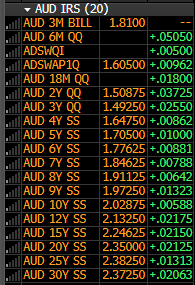
¹*
3) By way of example it is possible to Pay fixed for 5 years (1.705%) and receive BBSW floating (1.8768%) = carry benefit .1718bpts. By converting the semi annual basis to a monthly basis, an additional 10 bpts of positive carry would result. Similar examples can be worked out across different tenors.
As per our previous commentaries, simply because the central bank may or may not adjust the official cash rate, doesn’t correlate to a linear outcome in fixed rates and BBSW/BBSY floating rates. Swap rates are all time historical lows.
Together with our Stamford colleagues, we would be delighted to discuss opportunities of debt and interest rates with you.
Russell Maisner
Director, Global Treasury Risk Management Pty Ltd
Email: Russell@ecommplanet.com
Ph + 61 (0)401 125858
¹The table of rates are mid market rates extracted from Bloomberg and do not include any credit margins